Ethereum Price Analysis Points to $1K as Likely Market Bottom
Ethereum’s native token, Ether (ETH), has endured a steep drop of over 65% in just three months, leaving many long-term holders in the red. However, multiple onchain and technical indicators now suggest the downtrend could be nearing exhaustion, with $1,000 emerging as a possible floor.
Historical Patterns Repeat as ETH Mirrors Past Cycles
ETH’s current price action closely mirrors fractal patterns from 2018 and 2022. In both cases, a strong rally was followed by a sharp reversal and multi-month bear market. These cycles shared clear technical traits: higher price peaks coinciding with lower highs in the Relative Strength Index (RSI)—a classic sign of bearish divergence.
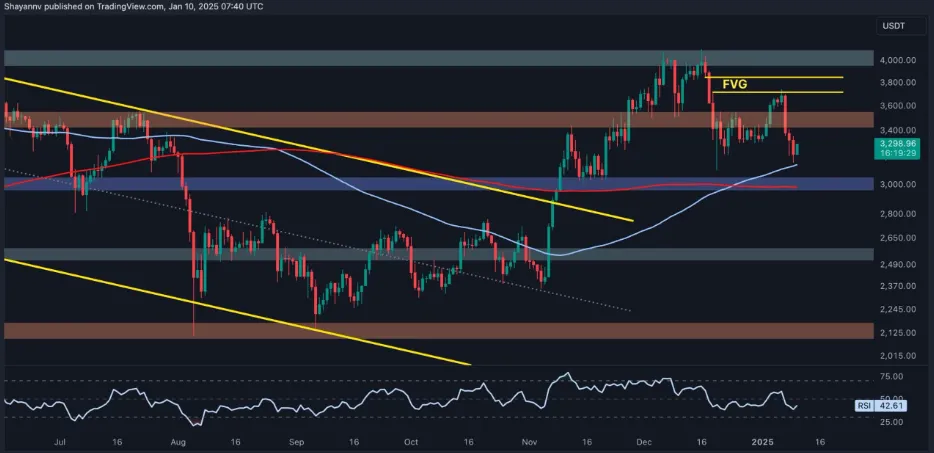
The recent high of $4,095 in December 2024 came with a declining RSI, mimicking earlier cycle tops and triggering the latest sell-off.
ETH has since fallen below the 1.0 Fibonacci retracement level, currently trading near $1,550, with the weekly RSI above 30, leaving room for more downside before hitting oversold conditions.

Fibonacci Support Hints at $990–$1,240 Target Zone
According to fractal analysis, if the current trend continues, Ethereum could bottom out within the $990 to $1,240 range. This range aligns with key Fibonacci retracement zones (0.618–0.786) where previous bear markets found support.
This scenario is supported by research from analysts such as Mike McGlone, who sees this area as historically reliable for reversals.
While no bottom is guaranteed, ETH’s structural similarity to previous cycles indicates that a long-term low may be forming soon.
Onchain Data Adds Weight to Bottoming Theory
In addition to technical signals, onchain data paints a similarly bearish-but-hopeful picture. Ethereum’s Net Unrealized Profit/Loss (NUPL) metric has now entered the “capitulation” zone, where the majority of holders are in net losses.
This same condition preceded major rebounds in March 2020 (COVID crash) and June 2022, when ETH bottomed near $880.
The NUPL’s decline into negative territory suggests that ETH is once again nearing a point of maximum pessimism, often associated with long-term accumulation opportunities.
Capitulation Near $1K May Offer Recovery Setup
While ETH has yet to confirm a definitive bottom, the convergence of multiple bearish signals—historical fractals, RSI divergence, Fibonacci zones, and NUPL capitulation—indicates that Ethereum could be in the final phase of its correction.
If these patterns hold true, the $1,000 level could soon serve as the foundation for Ethereum’s next recovery phase, particularly if broader market sentiment shifts or demand for ETH renews amid improved macro conditions.
Until then, cautious traders will continue watching the $990–$1,240 range closely as a key support zone with strong historical backing.