Bitcoin Weekly RSI Dips to 2023 Lows as $70K Emerges as Key Support
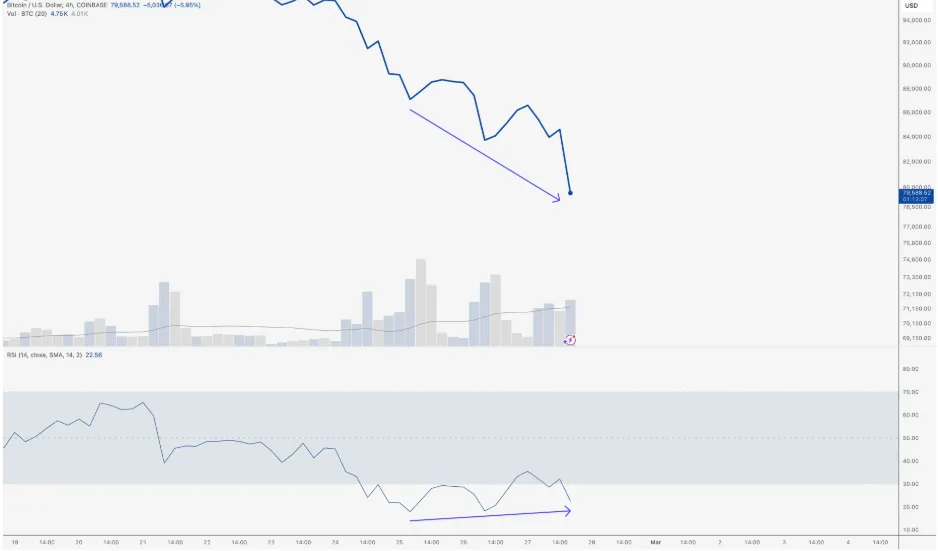
Bitcoin’s Relative Strength Index (RSI) has hit its lowest level since the start of 2023, stirring speculation that the $70,000 mark could represent the floor of the current price correction.
On April 7, crypto analyst Rekt Capital posted on X that BTC/USD might find strong support near the $70,000 zone — the same level that marked Bitcoin’s previous all-time high in late 2021.

History Points to $70K as Probable Reversal Zone
Analyzing historical RSI behavior, Rekt Capital suggested that although Bitcoin’s RSI has not yet reached “oversold” conditions, it is signaling a potential bottom is near. When BTC’s daily RSI previously fell below 28, the actual price bottom came slightly after, averaging between -0.32% and -8.44% deeper than the first dip.
At the moment, BTC is trading 2.79% below its previous low, and if the historical trend repeats, the price could fall to around $70,000 before reversing upward.
“A similar -8.44% drop from the first low would place the bottom at roughly $70K,” the analyst noted.
This kind of price action aligns with previous Bitcoin bull markets, where short-term pullbacks precede more substantial uptrends.
RSI: A Reliable Early Warning Tool
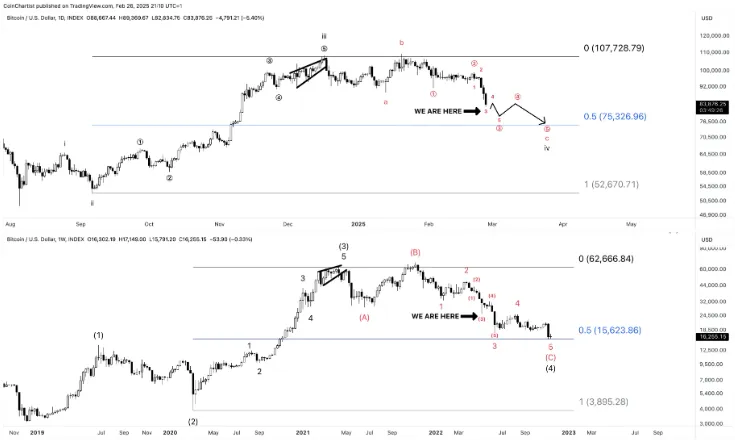
The RSI remains one of the most-watched leading indicators in crypto trading. On the daily chart, Bitcoin’s RSI is currently at 38, after being rejected at the neutral 50 mark. More significantly, the weekly RSI now sits at 43, its lowest level since Bitcoin began this bull cycle in early 2023, based on Cointelegraph Markets Pro and TradingView data.
While RSI scores below 30 generally indicate oversold conditions, even current levels are rare during a strong market phase and suggest that a reversal may be close.
A Bottom May Form Before $70K Hits
Despite the potential for BTC to revisit $70,000, Rekt Capital emphasized that such a move is not strictly necessary. The long-term bottom could form anywhere between current prices and the $70K zone, depending on broader market sentiment and momentum.
Notably, Bitcoin last touched the $70,000 mark in November 2024, a level that once represented extreme resistance during the final stages of the 2021 bull market.
Broader Macro Conditions Add Pressure
Beyond technicals, macroeconomic signals are clouding the short-term outlook for Bitcoin. As previously highlighted by Cointelegraph, the $70,000 zone is considered a critical support area by several models, including the Lowest Price Forward metric.
Still, network economist Timothy Peterson, the model’s creator, remains skeptical about Bitcoin’s immediate future. This week, he shared concerns on X, stating that US economic conditions could easily push Bitcoin down to $70,000 again.
“The macro environment looks seriously bad for Bitcoin,” Peterson warned, referencing rising high-yield credit risk reflected in the ICE BofA US High Yield Index.
What Comes Next for Bitcoin?
While short-term volatility may continue, the growing consensus among traders and analysts is that $70,000 could act as the ultimate correction low — a crucial base for Bitcoin to restart its upward journey. As RSI levels mirror those of early bull market phases, many are closely watching this zone for a strong rebound.
Until a clear reversal signal forms, traders are likely to treat the current range — from current levels to $70,000 — as a potential buy-the-dip opportunity.